2019-01-18 04:59:08 -06:00
|
|
|
# Debugging vs Code plugin and the Language Server
|
|
|
|
|
|
2020-01-29 07:45:32 -06:00
|
|
|
**NOTE:** the information here is mostly obsolete
|
|
|
|
|
|
2019-01-18 04:59:08 -06:00
|
|
|
Install [LLDB](https://lldb.llvm.org/) and the [LLDB Extension](https://marketplace.visualstudio.com/items?itemName=vadimcn.vscode-lldb).
|
|
|
|
|
|
|
|
|
|
Checkout rust rust-analyzer and open it in vscode.
|
|
|
|
|
|
|
|
|
|
```
|
|
|
|
|
$ git clone https://github.com/rust-analyzer/rust-analyzer.git --depth 1
|
|
|
|
|
$ cd rust-analyzer
|
|
|
|
|
$ code .
|
|
|
|
|
```
|
|
|
|
|
|
|
|
|
|
- To attach to the `lsp server` in linux you'll have to run:
|
|
|
|
|
|
|
|
|
|
`echo 0 | sudo tee /proc/sys/kernel/yama/ptrace_scope`
|
|
|
|
|
|
|
|
|
|
This enables ptrace on non forked processes
|
|
|
|
|
|
|
|
|
|
- Ensure the dependencies for the extension are installed, run the `npm: install - editors/code` task in vscode.
|
|
|
|
|
|
|
|
|
|
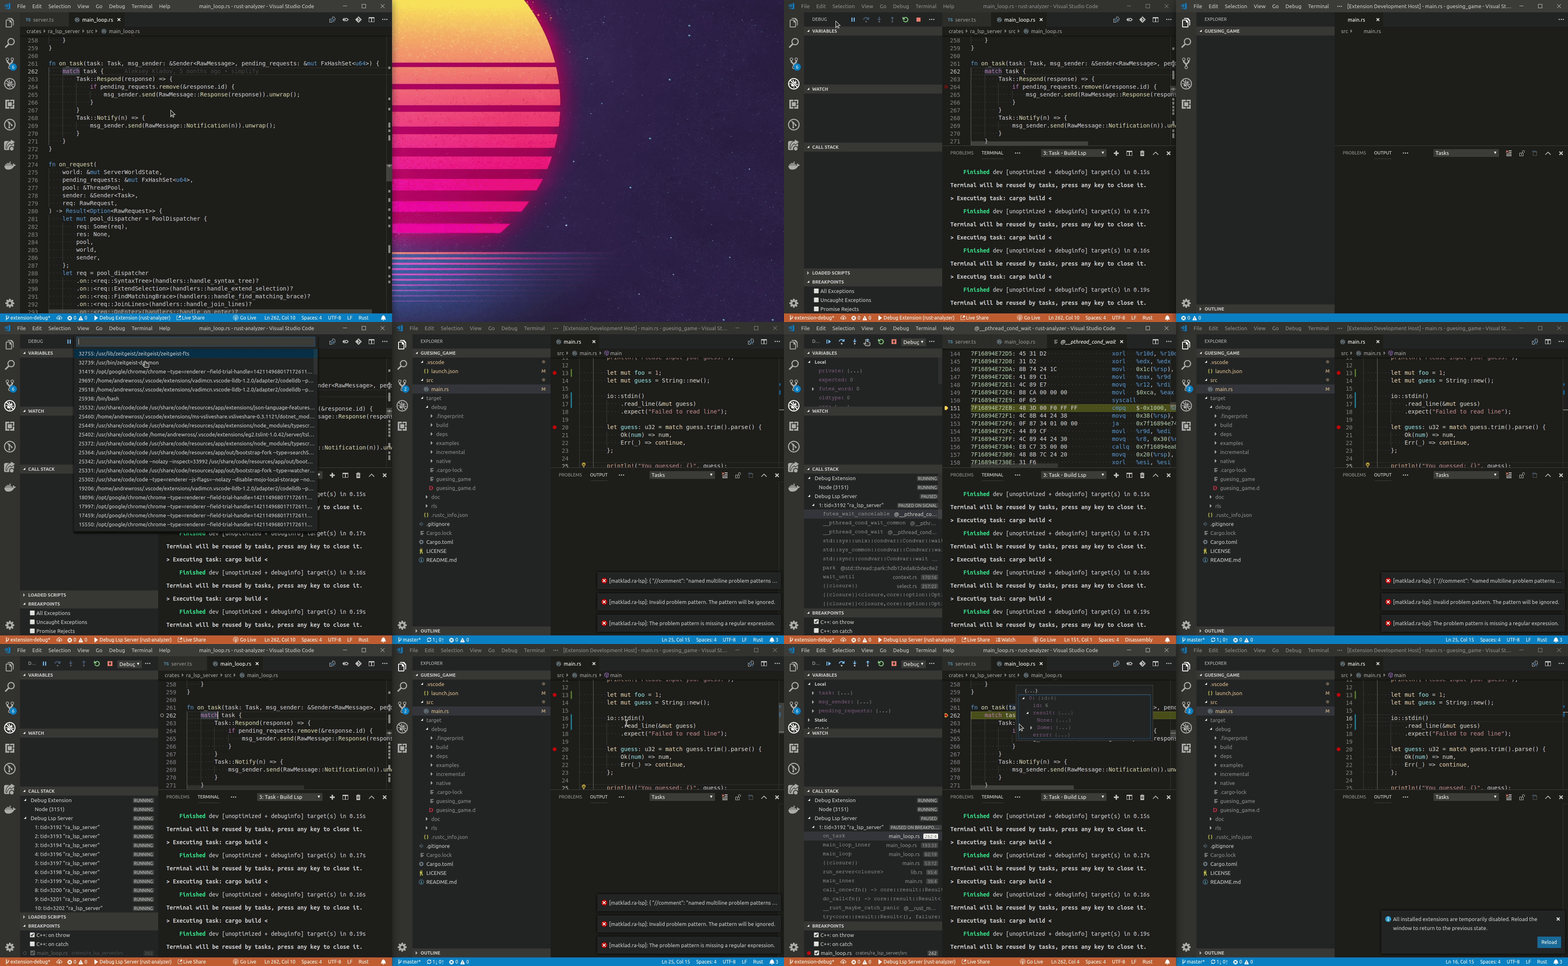
- Launch the `Debug Extension`, this will build the extension and the `lsp server`.
|
|
|
|
|
|
|
|
|
|
- A new instance of vscode with `[Extension Development Host]` in the title.
|
|
|
|
|
|
|
|
|
|
Don't worry about disabling `rls` all other extensions will be disabled but this one.
|
|
|
|
|
|
|
|
|
|
- In the new vscode instance open a rust project, and navigate to a rust file
|
|
|
|
|
|
|
|
|
|
- In the original vscode start an additional debug session (the three periods in the launch) and select `Debug Lsp Server`.
|
|
|
|
|
|
|
|
|
|
- A list of running processes should appear select the `ra_lsp_server` from this repo.
|
|
|
|
|
|
|
|
|
|
- Navigate to `crates/ra_lsp_server/src/main_loop.rs` and add a breakpoint to the `on_task` function.
|
|
|
|
|
|
|
|
|
|
- Go back to the `[Extension Development Host]` instance and hover over a rust variable and your breakpoint should hit.
|
|
|
|
|
|
|
|
|
|
## Demo
|
|
|
|
|
|
2019-01-18 05:23:17 -06:00
|
|
|

|
2019-01-18 04:59:08 -06:00
|
|
|
|
|
|
|
|
## Troubleshooting
|
|
|
|
|
|
|
|
|
|
### Can't find the `ra_lsp_server` process
|
|
|
|
|
|
|
|
|
|
It could be a case of just jumping the gun.
|
|
|
|
|
|
|
|
|
|
The `ra_lsp_server` is only started once the `onLanguage:rust` activation.
|
|
|
|
|
|
|
|
|
|
Make sure you open a rust file in the `[Extension Development Host]` and try again.
|
|
|
|
|
|
|
|
|
|
### Can't connect to `ra_lsp_server`
|
|
|
|
|
|
|
|
|
|
Make sure you have run `echo 0 | sudo tee /proc/sys/kernel/yama/ptrace_scope`.
|
|
|
|
|
|
|
|
|
|
By default this should reset back to 1 everytime you log in.
|
|
|
|
|
|
|
|
|
|
### Breakpoints are never being hit
|
|
|
|
|
|
|
|
|
|
Check your version of `lldb` if it's version 6 and lower use the `classic` adapter type.
|
|
|
|
|
It's `lldb.adapterType` in settings file.
|
|
|
|
|
|
|
|
|
|
If you're running `lldb` version 7 change the lldb adapter type to `bundled` or `native`.
|